The Case for Feature Engineering - Advances in Condition Monitoring, Pt III

Feature engineering can be powerful tool, but it doesn’t have to be complicated. Often, the simple solution is best.
In part two of this series, we went over the differences between the feature engineering approach and the end-to-end deep learning approach. The feature engineering approach can be labor intensive. But, I don’t want to discourage you. Feature engineering can be a great choice for many applications within the condition monitoring space. In fact, if you have a problem that can be elegantly solved using straightforward feature design and a simple model, then you should use that first. As noted by Daniel Kahneman in his book Thinking Fast and Slow, simple statistical rules regularly outperform more complex models. What would some of these simple applications look like? Here are a couple of examples.
Frequency Domain Technique for Combustion Engines
The first application we’ll look at is more of a feature engineering technique. In this example, total harmonic distortion (THD) is used to detect abnormalities on reciprocating machinery – machinery like internal combustion engines or reciprocating compressors. The application comes from a patent by Jeffrey Bizub of GE.1 I don’t usually appreciate reading patents, but this one was clear, and I like the simplicity of this idea.
The patent describes how an internal combustion engine produces a characteristic vibration pattern while in operation. The vibration signal is a superposition of many waveforms. Each component in the engine will have a primary vibration waveform (called its fundamental waveform) and then subsequent smaller waveforms belonging to that component (called harmonic waveforms).
When looking in the frequency domain, the fundamental waveform for a specific component will be represented by a large peak, and the harmonic waveforms will be represented by smaller peaks. The fundamental waveform vibrates at the fundamental frequency (or the natural frequency). The harmonic waveforms vibrate at frequencies that are at integral multiples of the fundamental frequency. The figure below, taken from the patent, shows a frequency domain representation of a signal, with the fundamental and harmonic frequencies labelled.
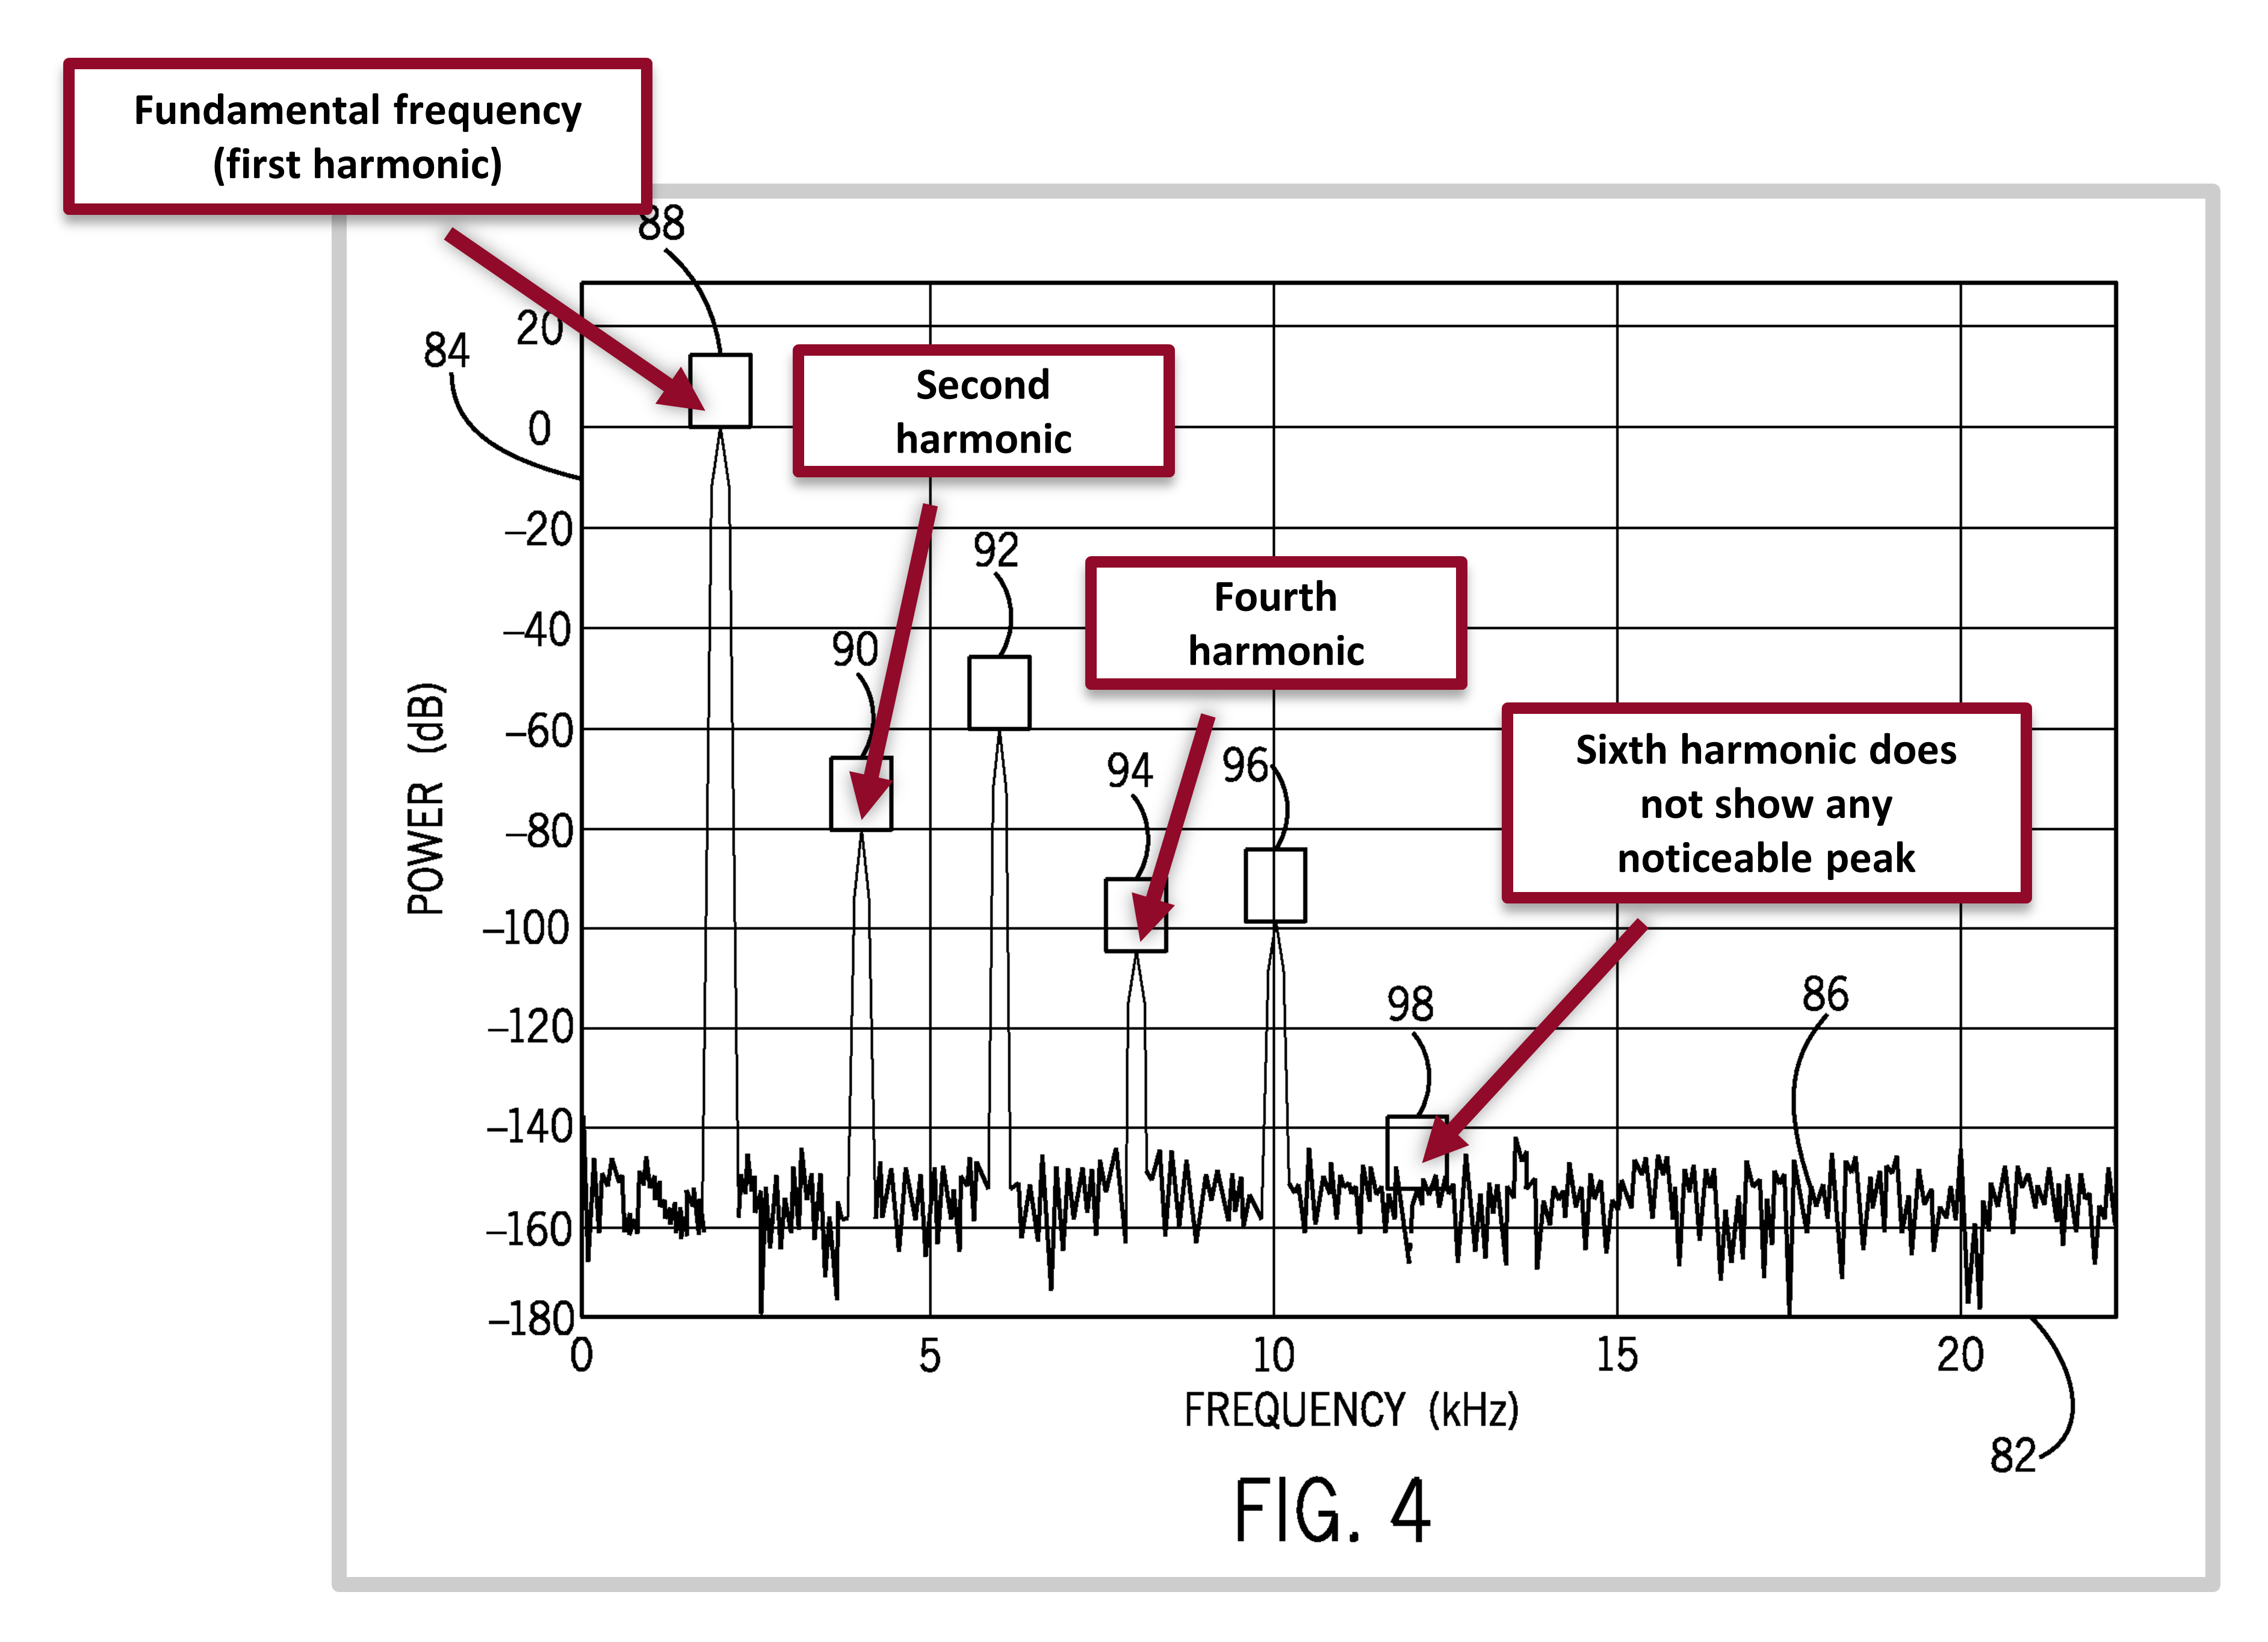
The fundamental and harmonic frequencies. Figure from the patent by Jeffrey Bizub.
The vibration signals will distort as components in the engine wear and the harmonics of these components become more dominant. This change in the waveform of the component can be measured by the total harmonic distortion, expressed as:
$$\text{THD} = \frac{\sqrt{(f_2^2+f_3^2+f_4^2+ \cdots + f_n^2)}}{f_1} \times 100 $$
where $f_2$, $f_3$, … $f_n$ are the amplitudes of the $n$ harmonic frequencies, and $f_1$ is the amplitude of the fundamental frequency.
The THD value can be trended over time, and a threshold value set to indicate when the engine component is in an unhealthy condition. The THD feature is used in other data-driven condition monitoring applications as well, from detecting faults in electric motors2, to assessing the health of fuel cells3. I worked THD into some of my work using data-driven condition monitoring and will be looking at it more in the future, perhaps in another post.
Classifying Mining Truck Oil Samples

Maintenance on mining haul trucks is an expensive affair. But sudden failures are even more expensive – costs can easily exceed $100,000 per failure. As such, regular oil samples are taken to monitor the health of these big trucks – think of it like a occasional blood sample you get taken from the doctor. Once the oil samples are taken, though, someone needs to review the results to identify if there are significant concerns. In the research presented here, the authors discuss how classifying the results, by hand, is time consuming. A model would go a long way in speeding up the review.4
The researchers used 400,000 hand-labelled oil sample results from large haul-truck diesel engines in Australia. They then selected six of the best variables from the results, variables like the amount of iron in the sample, to use in the model training. The authors trained both a logistic regression model and a support vector machine (SVM) model to either classify the oil sample from a healthy, or unhealthy, engine.
The logistic regression model outperformed the SVM model. The authors also make an interesting point about the explanatory power of the simpler logistic regression model, which I also find compelling:
“…the logistic regression model was simple to explain, there were no difficulties in explaining the method, and they could reconcile the weights of the explanatory variables with their understanding of failure modes for these engines.”
I like this example for its simplicity. No complicated feature engineering is needed. Rather, experts are asked to select the variable – the features – that are most indicative of engine health. No complicated model is used. Rather, a straightforward logistic regression is implemented. And finally, the authors are cognizant of how the results will be perceived by the customer. Trust is gained, between them and the end-user, by using model that can be interpreted.
References
-
Bizub, Jeffrey Jacob. “Methods and systems to derive engine component health using total harmonic distortion in a knock sensor signal.” U. S. Patent No. 9, 791, 343. 17 Oct. 2017. ↩︎
-
F II, I. “IEEE recommended practices and requirements for harmonic control in electrical power systems.” New York, NY, USA (1993): 1-1. ↩︎
-
Thomas, Sobi, et al. “Online health monitoring of a fuel cell using total harmonic distortion analysis.” international journal of hydrogen energy 39.9 (2014): 4558-4565. ↩︎
-
Phillips, J., et al. “Classifying machinery condition using oil samples and binary logistic regression.” Mechanical Systems and Signal Processing 60 (2015): 316-325. ↩︎